

Weighted On-Target Percentage: 2026 NFL Draft QB charting database
It's live! Here are the charts for the 2026 NFL Draft class of quarterbacks! From Fernando Mendoza to Maverick McIvor, I've got you covered!

We are through the cupcake part of the college football season, and the 2026 NFL Draft crop of quarterbacks is now getting into conference play.
You know what that means. It’s time to fire up the Weighted On-Target Percentage charting database. I’ve already charted over 20 games on the season from some of the top quarterbacks, but there are plenty more to go with just three weeks of football in the wind.
This is now the fifth season that I have been charting quarterbacks, and by this point, my process has become pretty clean. It’s never above improvement or adjustment as more data is collected, but the results it has yielded over the years have translated well to the next level.
But before we get to the charts, let’s talk about what Weighted On-Target Percentage is, what the methodology behind the charts is, how to read them, and more.

The methodology behind Weighted On-Target Percentage
I want to reward high-leverage and big-time throws that quarterbacks are capable of making. Those are the game-changing plays, especially as they become rarer at the NFL level as explosive play rates continue to fall. So when a quarterback has the opportunity to stretch the field, they need to be able to connect.
Throughout the four years that I have been charting now as well, deep throws (25+ yards in depth) have the highest difference in standard deviation as well. This is where great quarterbacks separate themselves from good ones.
Similarly, boundary throws are going to be weighed slightly higher than throws over the middle, and middle-of-the-field throws will carry a larger weight than the short game (the least difference in standard deviation among quarterbacks).
When weighing their on-target percentage to each of these four levels of the field, I will get one solid number: their Weighted On-Target Percentage.
Changes made to the methodology
Starting last season, I made one small change to my process: I am no longer charting the mismatch games. This means Power Four quarterbacks will not get charts added to their data for the matchups against Group of Six and FCS competition.
You can find a study that I did with the 2025 NFL Draft class here.
I found that it did not make a huge difference to the overall Weighted On-Target Percentages, but did weed out an outlier. So if the cost of charting fewer games is weeding out a rare outlier with minimal overall impact, then that’s the move to take.
And it just so happens to take a chunk of work off my plate.
This is why you will see quarterbacks like Indiana’s Fernando Mendoza and Penn State’s Drew Allar do not have a single chart in the database at launch (as of 9/19).

Understanding the charts
When looking through the charts, you will see five different colors: green, red, blue, yellow, and black. Here are the breakdowns of what these colors mean:
Green: On-target and a completion
Red: Off-target and incomplete
Blue: On-target and incomplete
Yellow: Off-target but completed
Black: Unchartable throw
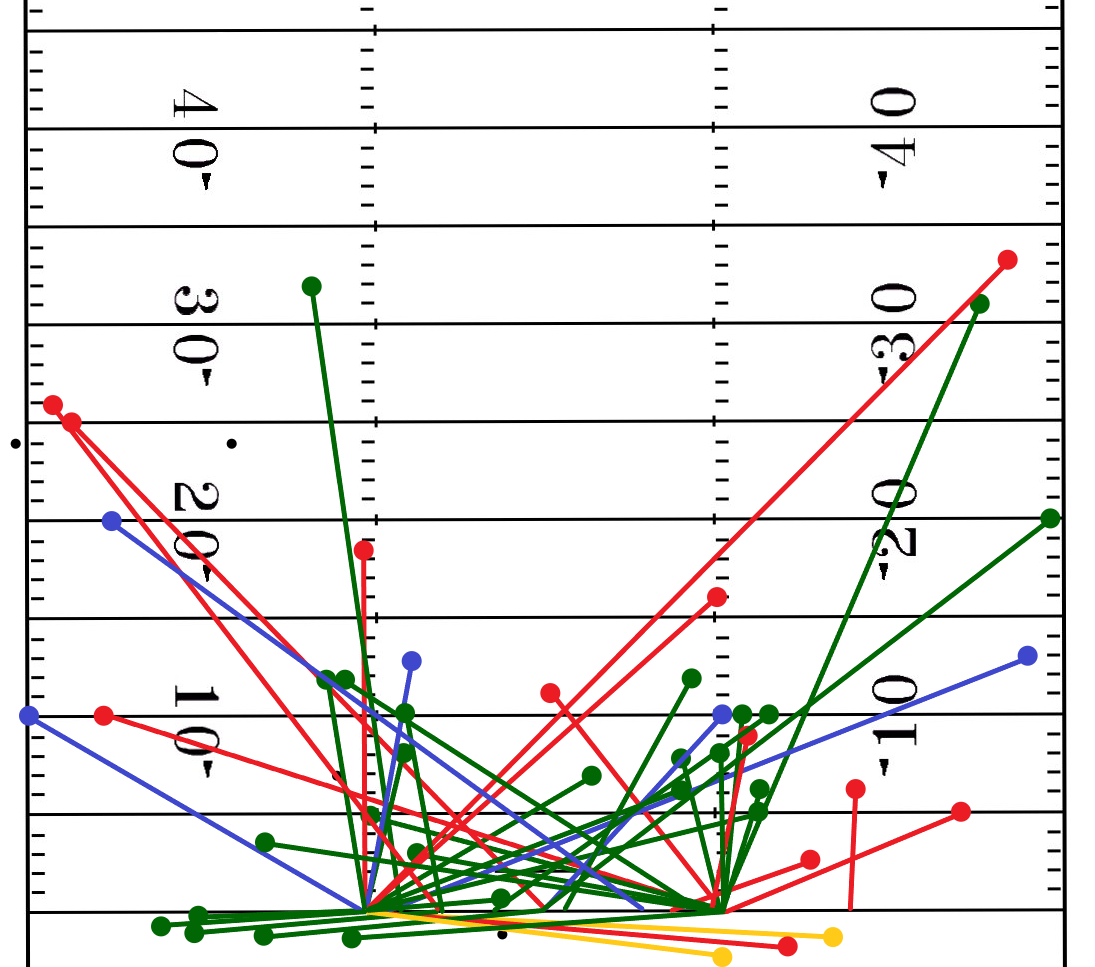
When referring to the totals to the right of the charts, these tallies are percentages of on-target throws. If a deep ball is leveraged correctly and hits the right landmark but is not tracked appropriately by the wideout or dropped, then that ball will be deemed on-target, and the quarterback will be given credit for that throw.
If the receiver catches a throw but takes a substantial adjustment because the throw is leveraged back into coverage or on the wrong shoulder, I’ll ding the quarterback for that throw.
This might seem ticky-tacky, but the margin for error when evaluating quarterbacks and what makes them tick at the NFL is razor-thin. It’s necessary to be critical.
Uncharted throws include throwaways, miscommunications between the wide receiver and quarterback, quarterback hits that significantly impact the flight of the football, and Hail Marys.
For a better visual example, you can watch any live charting that I’ve done on the Substack. Here is the most recent one that I did on Arkansas quarterback Taylen Green vs. Ole Miss:

The Limitations of Weighted On-Target Percentage
This is not the full picture of a quarterback’s NFL Draft profile, however. This simply helps to distinguish and prioritize which quarterbacks thrive more at levels of the field that create more explosive plays.
Weighted On-Target Percentage does not tell how strong a quarterback’s arm is. It does not indicate how they manage a difficult pocket. It doesn’t measure the speed of a quarterback’s eyes at dissecting a coverage post-snap or what they are seeing pre-snap. It simply measures ball placement and accuracy.
And sometimes even the final number can be a bit deceiving. Bo Nix’s chart out of Oregon from the 2023 season is a great example of this, as is Bailey Zappe’s when he was coming out of Western Kentucky.
Both of those quarterbacks finished with a Weighted On-Target Percentage of around 70 and lingered near the top of their classes. However, their volume of underneath throws was in some cases 30 percent more than others in the class. Naturally, their number is going to be inflated if they only threw 15 deep balls all season and were on target on 8 of them.
There is more to the evaluation of a quarterback than strictly Weighted On-Target Percentage. My hope, however, is that it is a significant tool to help dissect one of the key aspects of playing the quarterback position: ball placement and accuracy.
Find the 2026 NFL Draft Weighted On-Target Percentage charts here!
Keep reading with a 7-day free trial
Subscribe to Daft on Draft to keep reading this post and get 7 days of free access to the full post archives.